[Tutorial Kit] Infographics for Social Media: Prenatal Care
- Shamini V De Silva
- Mar 19
- 5 min read
Updated: Jul 12
Workshop Chapters
Recorded live Jan 27 2026, timestamps are below.
PART 1:
0:00 - Welcome
0:46 - About Us
3:00 - Addressing Imposter Syndrome
4:25 - Data Challenge Overview
4:49 - Q: What is a Key Stakeholder?
6:47 - TOPIC: Prenatal Care
PART 2:
8:57 - STEP-BY-STEP
13:35 - GETTING DATA
Continuing Educational Credit
CHES® / MCHES®
BroadStreet Institute is a designated provider (ID# 1167363) of continuing education contact hours (CECH) in health education by the National Commission for Health Education Credentialing, Inc. Total contact hours earned 1 • Entry-level contact hours earned 1 • Advanced-level contact hours earned 0.
CPH (Certified in Public Health) Recertification Credits
The BroadStreet Institute is an approved provider of Certified in Public Health (CPH) Recertification Credits by the National Board of Public Health Examiners. Up to 1 CPH Recertification Credits may be earned at this event.
🎯 Data Challenge
Create an infographic for social media about prenatal care in your region.
The Plan
Collect key indicators for your community using free sources of prenatal care data in the United states, learn how data can power art and design, and create a portfolio project:

3 Learning Objectives
Identify, Query & Collect 📊 secondary data on prenatal care in your selected community or region.
Analyze selected data to describe prenatal care access status of a priority population using a data tool: 🧰 🛠️ Canva Sheets.
Visualize & Humanize data by creating a 🎨 data visualization or infographic that communicates a prenatal care-related message to a defined stakeholder or target audience.
Conflicts of Interest Disclosure
There are no financial conflicts of interest to disclose. None of the presenters or organizers of this event have any financial relationship, nor affiliation with the brands and organizations mentioned in this tutorial.
Prerequisites. Beginner-friendly, no prior experience needed
Keywords and core concepts also covered:
Human-centered, design-first data
Spreadsheet formulas (e.g. concatenate, if/then)
Upstream/Downstream health indicators
Here's what you'll need to successfully complete this challenge
⏰ Time. 20-40 minutes
🧰 Tools:
An account in Canva.
🎨 Design Template in Canva (link below)
📊 Data.
Health Indicator: Prenatal Care in the first trimester (%) (2020-2022). Estimated percentage of live births with first trimester prenatal care entry.
Data Source: Maternal and Infant Health Mapping Tool, Health Resources and Services Administration (2020-2022). https://data.hrsa.gov/topics/maternal-child-health/mchb-mapping
Step-by-Step walkthrough
The steps below will guide you to create a county-level health infographic for Instagram (a.k.a. "Infogram") using Canva Sheets.
Step 1: Open Canva Sheets
Go to Canva Sheets template and click "Edit template" to create your own copy of the project.
Login to Canva. If you do not have an account, you can create one for free.
Set the View = PAGES (bottom right). The "Pages" view is the best way to view spreadsheets in Canva. Please watch the video above for more details (timestamp: 08:57 - STEP-BY-STEP).
Familiarize yourself with the layout: Canva Sheets on page 2, Instructions on page 3-4, followed by examples and templates

Step 2: Find Your Data Using the Maternal & Infant Health Mapping Tool
Open the Maternal and Infant Health Mapping Tool (a free, publicly available resource).
On the left-hand side, you'll see an accordion menu listing available data categories. Click to expand.
Navigate to: "Health Indicators" → “Prenatal Care in the 1st Trimester (%)”.
For “Prenatal Care in the 1st Trimester (%)”, select the year range: "2020–2022".
Once the data loads, see the table at the bottom of the screen with the county-level data.
Use the filter feature in each table column (under the column name) to narrow results down to your state, then repeat to filter for a specific county (e.g., Milwaukee County).
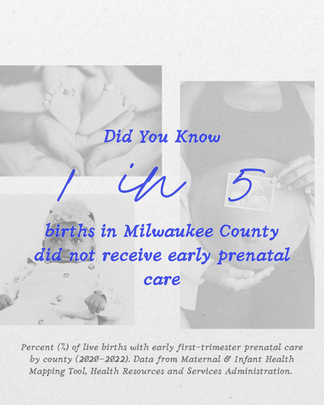
Locate data for your county under the “Prenatal Care in the 1st Trimester” column. For example: 78.2% of live births in Milwaukee County were estimated to have prenatal care initiated in the first trimester.
Optional: Export the full dataset to Excel if you need data for multiple states/counties.


Step 3: Enter the Data into Canva Sheets
Go to Canva Sheets (Template page 2), find the spreadsheet cell for your percent value.
Enter the figure as a decimal — i.e., type 0.782 as the column has been pre-formatted to show percentages.
In the column ‘County vs. U.S. Benchmark’, indicate whether the percentage for the chosen county is ‘High’ or ‘Low’ compared to the U.S. Benchmark (found below the cell with column name ‘Percent (%) with Early Prenatal Care’).
Step 4: Let the Formulas Do the Work
The template provided is set up with built-in formulas that automatically:
Flip the percentage — subtracting from 100 to show the percent without early prenatal care (e.g., 21.8%)
Convert the percent to a plain-language fraction — e.g., "1 in 5"
Use a CONCATENATE formula to build a full sentence like: "1 in 5 babies born in Milwaukee County did not receive early prenatal care."
Tailoring infographics to your audience. For social media audiences who are quickly scrolling through an instagram feed, a large font with relatable numbers (e.g., "1 in 5") will be easier to read and understand compared to raw percentages (e.g., 21.8%).
Step 5: Applying the Data to Your Instagram Design
Go to the page in the template with your design.
Update the design as needed
Edit the text on the infographic to match the formatted sentence in the spreadsheet (e.g., “About 1 in 5 of babies born in Milwaukee County, WI did not receive early prenatal care.”).
To download your infographic: Click on "Share" at the top right corner, click "Download". Download File Type as a .png or .jpeg file for images and as .mp4 file for reels/videos. Select page and click "DOWNLOAD"
Creating Bulk Infographics
Canva Sheets also offers ‘Bulk Create’ (Canva Pro Feature) for creating unique infographics for every county in your state in a few clicks. If interested, please check the video for more details (timestamp: 08:57 - STEP-BY-STEP).
You've Earned a Certificate! | |
BroadStreet Certificate (FREE) | |
CHES® / MCHES® Credit1 total credit hours ($10) | |
CPH - Certified in Public Health Recertification Credits (1 credit hr) ($10) | |
Note: We review projects every 2-4 weeks, typically at the end of the month.
Examples of Infographics for Social Media
Thank you to Marlee O’Brien Graeser, BSPH for your unique design (left) and to our participants for building upon the template!


Instructors
 | Tracy Flood MD PhD President and Co-founder BroadStreet Institute Dr. Flood has over a decade experience in foraging for community health data, as well as in data visualization, report writing, mapping, and data design for software. She is passionate about empowering community change, increasing data literacy, and turning data into actions that will have long-term impact. She has worked with over 2,000 interns as President of BroadStreet. |