top of page
Tutorial Kits
![[Tutorial Kit] Infographics for Social Media: Measles Immunization Rates](https://static.wixstatic.com/media/3aa850_720c8a71c1e5418f9d75381335b05e44~mv2.png/v1/fill/w_444,h_250,fp_0.50_0.50,q_35,blur_30,enc_avif,quality_auto/3aa850_720c8a71c1e5418f9d75381335b05e44~mv2.webp)
![[Tutorial Kit] Infographics for Social Media: Measles Immunization Rates](https://static.wixstatic.com/media/3aa850_720c8a71c1e5418f9d75381335b05e44~mv2.png/v1/fill/w_551,h_310,fp_0.50_0.50,q_95,enc_avif,quality_auto/3aa850_720c8a71c1e5418f9d75381335b05e44~mv2.webp)
[Tutorial Kit] Infographics for Social Media: Measles Immunization Rates
Create a video infographic about measles immunization coverage rates (a.k.a. vaccination rates) your county and how rates compare to the recommended community immunity threshold of 95%.
![[Tutorial Kit] Measles Immunization Coverage Rates: Building a Community Narrative](https://static.wixstatic.com/media/3aa850_ba41d5cb839840308b8606c3f68835fa~mv2.png/v1/fill/w_444,h_250,fp_0.50_0.50,q_35,blur_30,enc_avif,quality_auto/3aa850_ba41d5cb839840308b8606c3f68835fa~mv2.webp)
![[Tutorial Kit] Measles Immunization Coverage Rates: Building a Community Narrative](https://static.wixstatic.com/media/3aa850_ba41d5cb839840308b8606c3f68835fa~mv2.png/v1/fill/w_551,h_310,fp_0.50_0.50,q_95,enc_avif,quality_auto/3aa850_ba41d5cb839840308b8606c3f68835fa~mv2.webp)
[Tutorial Kit] Measles Immunization Coverage Rates: Building a Community Narrative
Create a data narrative or "data story" about measles immunization coverage rates in your county and how rates compare to the recommended community immunity threshold of 95%.
![[Tutorial Kit] Building a Community Health Indicator List for Air Quality](https://static.wixstatic.com/media/3aa850_c039029f31ff43988e09abd3830fd87e~mv2.png/v1/fill/w_444,h_250,fp_0.50_0.50,q_35,blur_30,enc_avif,quality_auto/3aa850_c039029f31ff43988e09abd3830fd87e~mv2.webp)
![[Tutorial Kit] Building a Community Health Indicator List for Air Quality](https://static.wixstatic.com/media/3aa850_c039029f31ff43988e09abd3830fd87e~mv2.png/v1/fill/w_551,h_310,fp_0.50_0.50,q_95,enc_avif,quality_auto/3aa850_c039029f31ff43988e09abd3830fd87e~mv2.webp)
[Tutorial Kit] Building a Community Health Indicator List for Air Quality
Create a data story for air pollution in your region by comparing local concentrations of PM2.5 to the standard set by the Environmental Protection Agency.
![[Tutorial Kit] Infographics for Social Media: Air Quality](https://static.wixstatic.com/media/3aa850_71d5f1db4cf94ed9ad0b7ee2c1a20dcc~mv2.png/v1/fill/w_444,h_250,fp_0.50_0.50,q_35,blur_30,enc_avif,quality_auto/3aa850_71d5f1db4cf94ed9ad0b7ee2c1a20dcc~mv2.webp)
![[Tutorial Kit] Infographics for Social Media: Air Quality](https://static.wixstatic.com/media/3aa850_71d5f1db4cf94ed9ad0b7ee2c1a20dcc~mv2.png/v1/fill/w_551,h_310,fp_0.50_0.50,q_95,enc_avif,quality_auto/3aa850_71d5f1db4cf94ed9ad0b7ee2c1a20dcc~mv2.webp)
[Tutorial Kit] Infographics for Social Media: Air Quality
Create an infographic video in canva using data on air quality and specifically PM2.5 rates in your county.
![[Tutorial Kit] AI-Assisted Needs Assessment: Structured Prompting to Identify Emerging Public Health Topics](https://static.wixstatic.com/media/3aa850_97c9ce4f26d44d20afb0eac4b9e878c5~mv2.png/v1/fill/w_444,h_250,fp_0.50_0.50,q_35,blur_30,enc_avif,quality_auto/3aa850_97c9ce4f26d44d20afb0eac4b9e878c5~mv2.webp)
![[Tutorial Kit] AI-Assisted Needs Assessment: Structured Prompting to Identify Emerging Public Health Topics](https://static.wixstatic.com/media/3aa850_97c9ce4f26d44d20afb0eac4b9e878c5~mv2.png/v1/fill/w_551,h_310,fp_0.50_0.50,q_95,enc_avif,quality_auto/3aa850_97c9ce4f26d44d20afb0eac4b9e878c5~mv2.webp)
[Tutorial Kit] AI-Assisted Needs Assessment: Structured Prompting to Identify Emerging Public Health Topics
Prioritize the top trending public health topic in the U.S. using a combination of AI and traditional public health prioritization processes.
![[Tutorial Kit] Building a Community Health Indicator List for Prenatal Care in Airtable](https://static.wixstatic.com/media/3aa850_4e89945e586749f39e474b7e3992c1f6~mv2.png/v1/fill/w_444,h_250,fp_0.50_0.50,q_35,blur_30,enc_avif,quality_auto/3aa850_4e89945e586749f39e474b7e3992c1f6~mv2.webp)
![[Tutorial Kit] Building a Community Health Indicator List for Prenatal Care in Airtable](https://static.wixstatic.com/media/3aa850_4e89945e586749f39e474b7e3992c1f6~mv2.png/v1/fill/w_551,h_310,fp_0.50_0.50,q_95,enc_avif,quality_auto/3aa850_4e89945e586749f39e474b7e3992c1f6~mv2.webp)
[Tutorial Kit] Building a Community Health Indicator List for Prenatal Care in Airtable
Create a data story on prenatal care in your region using Airtable.
![[Tutorial Kit] Infographics for Social Media: Prenatal Care](https://static.wixstatic.com/media/3aa850_8463e486557d4cd5adea23b4bb9180f2~mv2.png/v1/fill/w_444,h_250,fp_0.50_0.50,q_35,blur_30,enc_avif,quality_auto/3aa850_8463e486557d4cd5adea23b4bb9180f2~mv2.webp)
![[Tutorial Kit] Infographics for Social Media: Prenatal Care](https://static.wixstatic.com/media/3aa850_8463e486557d4cd5adea23b4bb9180f2~mv2.png/v1/fill/w_551,h_310,fp_0.50_0.50,q_95,enc_avif,quality_auto/3aa850_8463e486557d4cd5adea23b4bb9180f2~mv2.webp)
[Tutorial Kit] Infographics for Social Media: Prenatal Care
Create an infographic for social media about prenatal care in your region.
![[Tutorial Kit] Using RStudio to Analyze and Visualize Air Quality](https://static.wixstatic.com/media/3aa850_c0c05ce650db48f5a26865929166c978~mv2.png/v1/fill/w_444,h_250,fp_0.50_0.50,q_35,blur_30,enc_avif,quality_auto/3aa850_c0c05ce650db48f5a26865929166c978~mv2.webp)
![[Tutorial Kit] Using RStudio to Analyze and Visualize Air Quality](https://static.wixstatic.com/media/3aa850_c0c05ce650db48f5a26865929166c978~mv2.png/v1/fill/w_551,h_310,fp_0.50_0.50,q_95,enc_avif,quality_auto/3aa850_c0c05ce650db48f5a26865929166c978~mv2.webp)
[Tutorial Kit] Using RStudio to Analyze and Visualize Air Quality
Create a bar chart in RStudio on air pollution for your state and compare three counties with the highest air pollution levels to the standard set by U.S. Environmental Protection Agency (EPA).
![[Tutorial Kit] Using RStudio to Analyze and Visualize Prenatal Care Rates](https://static.wixstatic.com/media/3aa850_e609565cf9a644e39c0ce0758ac5369c~mv2.png/v1/fill/w_444,h_250,fp_0.50_0.50,q_35,blur_30,enc_avif,quality_auto/3aa850_e609565cf9a644e39c0ce0758ac5369c~mv2.webp)
![[Tutorial Kit] Using RStudio to Analyze and Visualize Prenatal Care Rates](https://static.wixstatic.com/media/3aa850_e609565cf9a644e39c0ce0758ac5369c~mv2.png/v1/fill/w_551,h_310,fp_0.50_0.50,q_95,enc_avif,quality_auto/3aa850_e609565cf9a644e39c0ce0758ac5369c~mv2.webp)
[Tutorial Kit] Using RStudio to Analyze and Visualize Prenatal Care Rates
Create a bar chart on prenatal care for your county and state using RStudio (online).
All Projects and Updates
Search
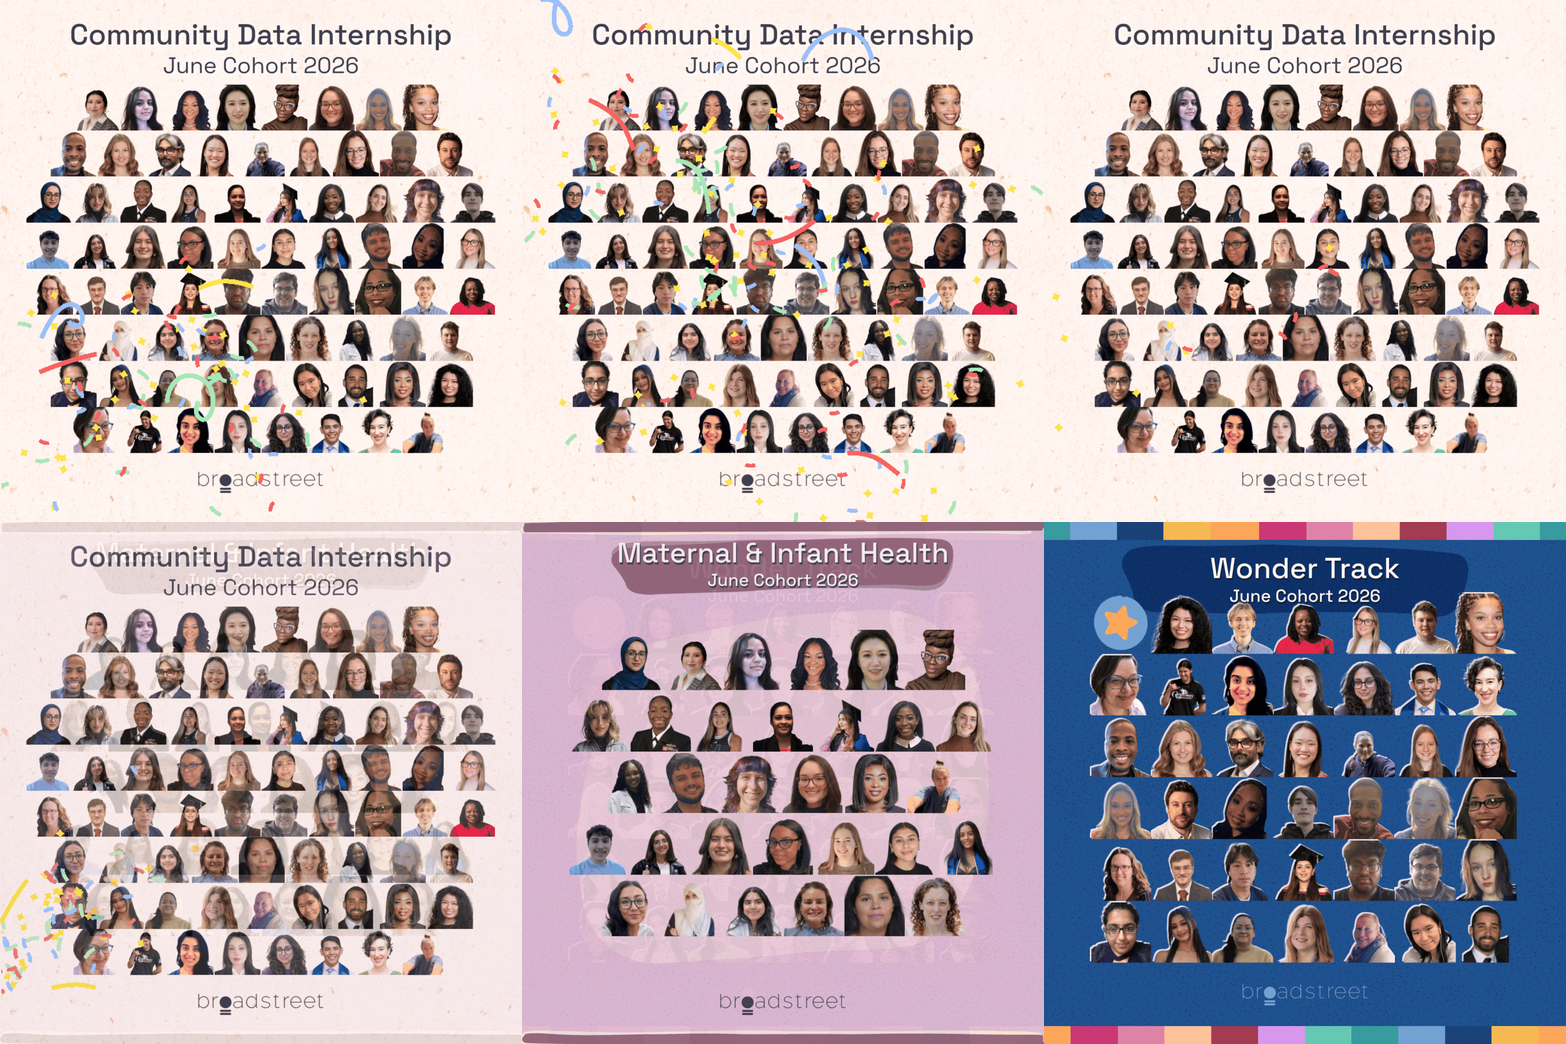

Community Data Internship - June Cohort 2026
A huge congratulations to the Community Data Interns in the June Cohort. For 10 weeks, teams created proposals for a data-guided donation or advocacy plan.

Tracy Flood
Aug 152 min read
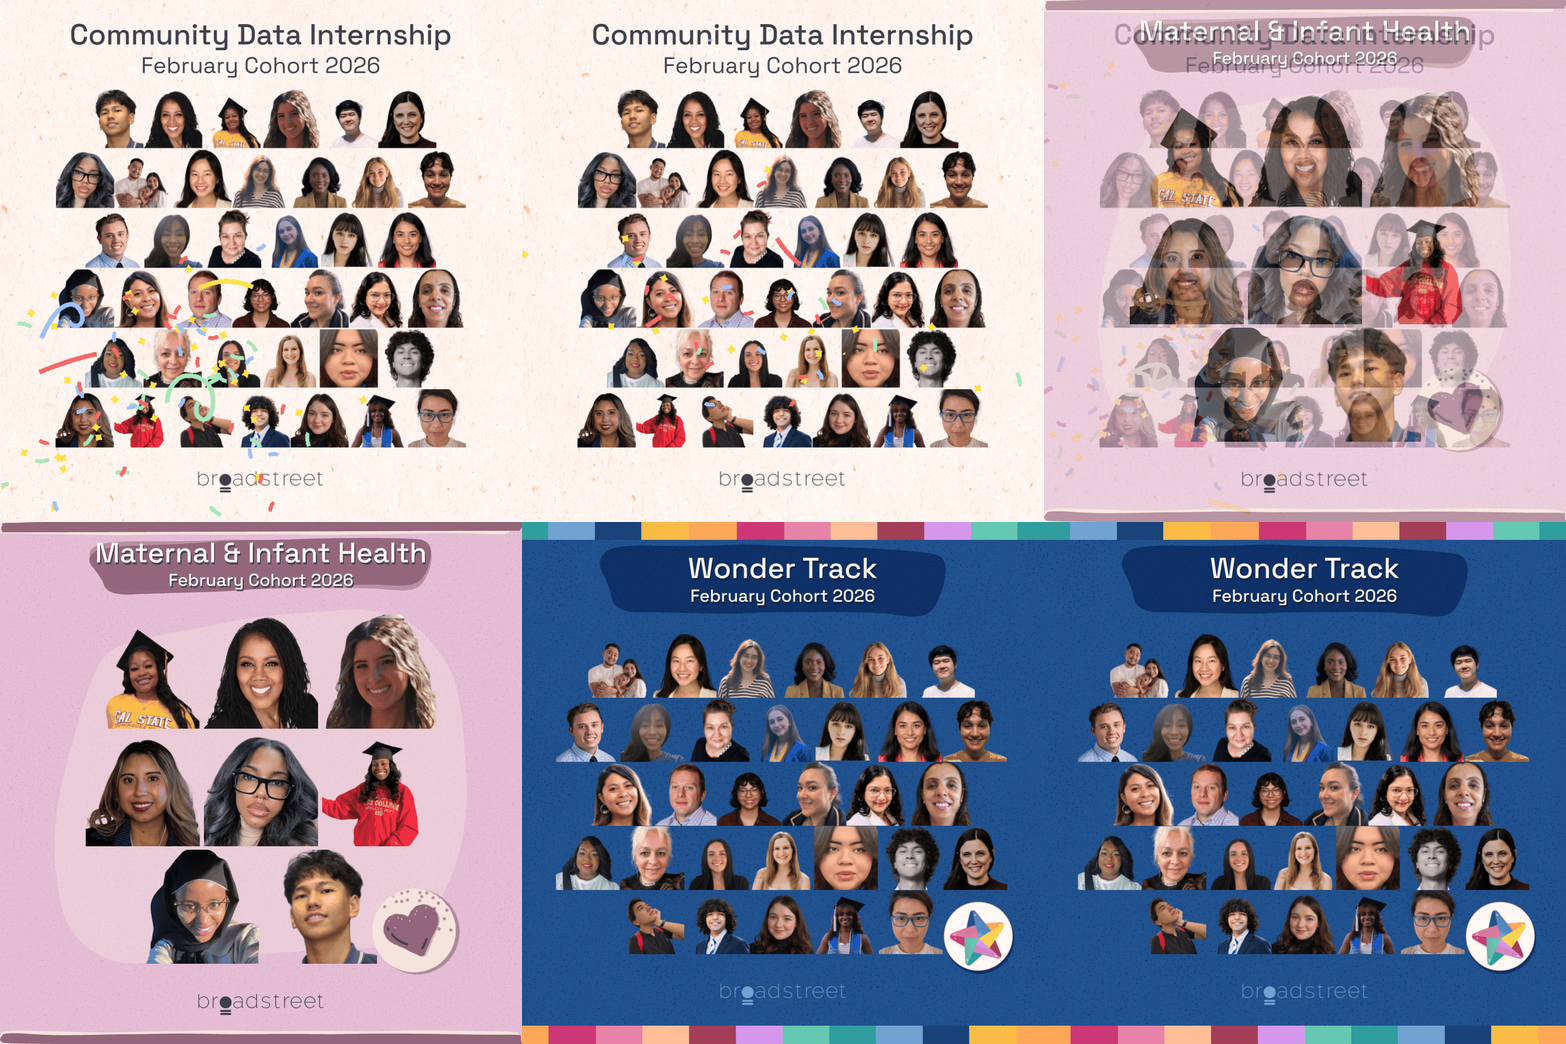

Community Data Internship - February Cohort 2026
Congratulations to the 57 Community Data Interns who joined the BroadStreet Institute in February 2026.

Tracy Flood
May 161 min read
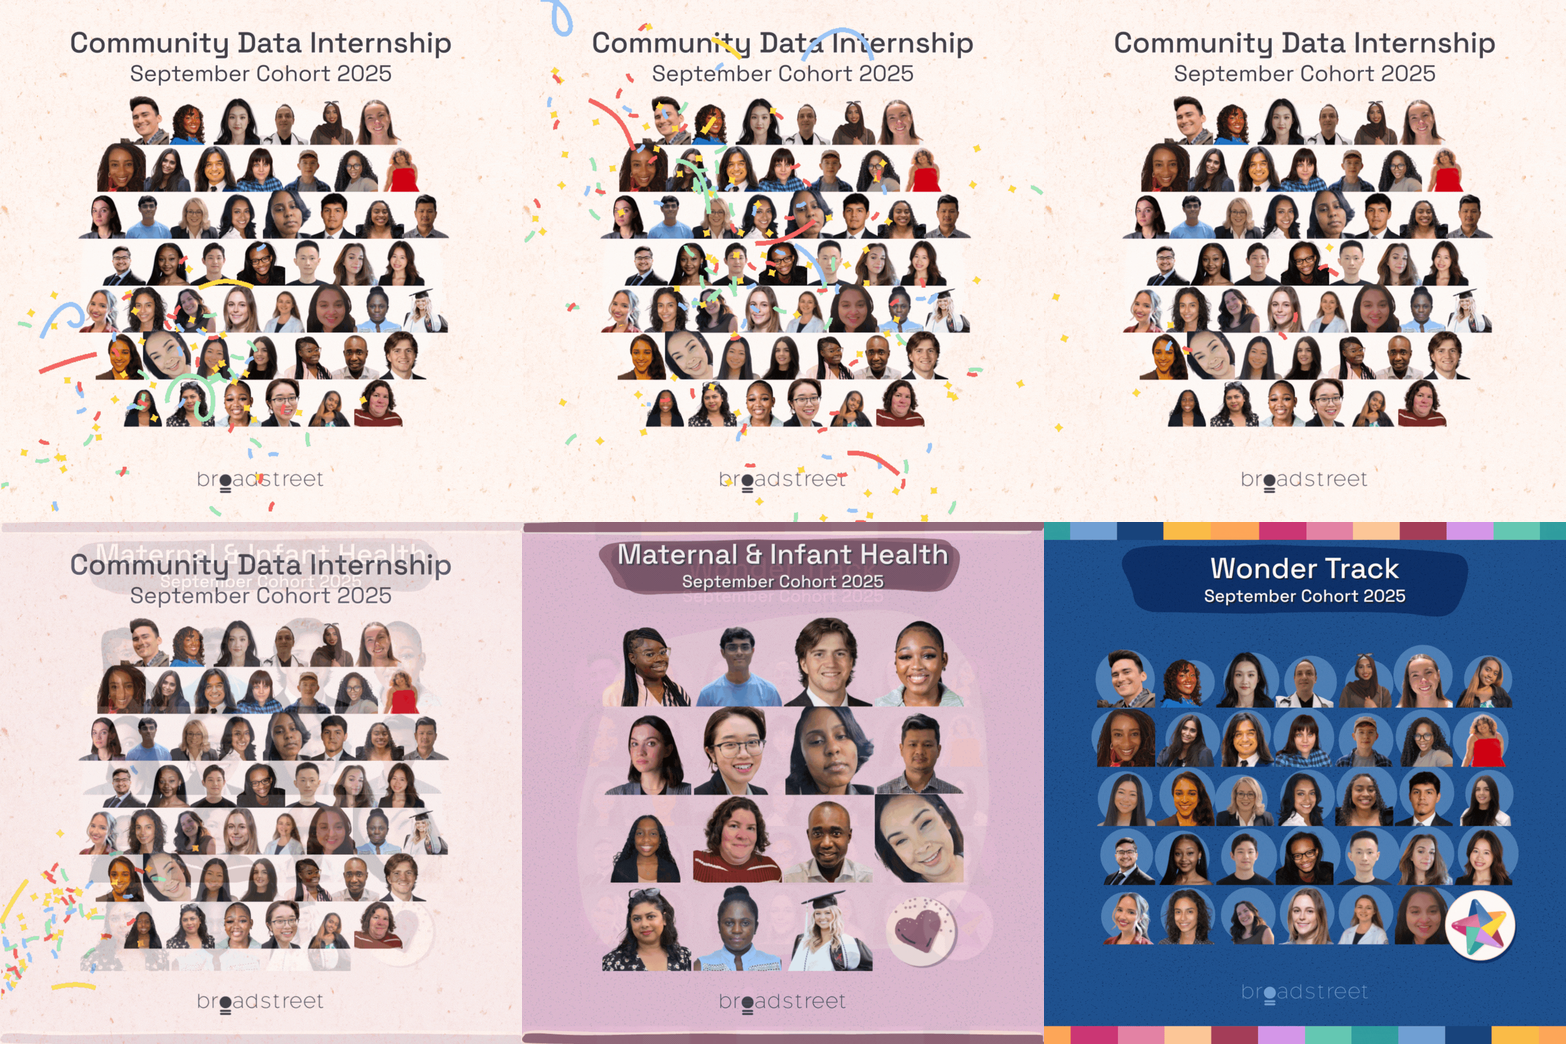

Community Data Internship - September Cohort 2025
Three months ago we welcomed 58 new Community Data Interns to the BroadStreet Institute. Together with teammates and leaders they have explored data in the United States on leading causes of death (Wonder Track) and maternal mortality (Maternal & Infant Health Track) to uncover areas of opportunity for data-guided donations and advocacy for policymakers. 🎉 Congrats to the 2025 September Cohort for wrapping up your 14 week internship! ❤️ Maternal & Infant Health: Alyssa Monde

Tracy Flood
Dec 13, 20251 min read
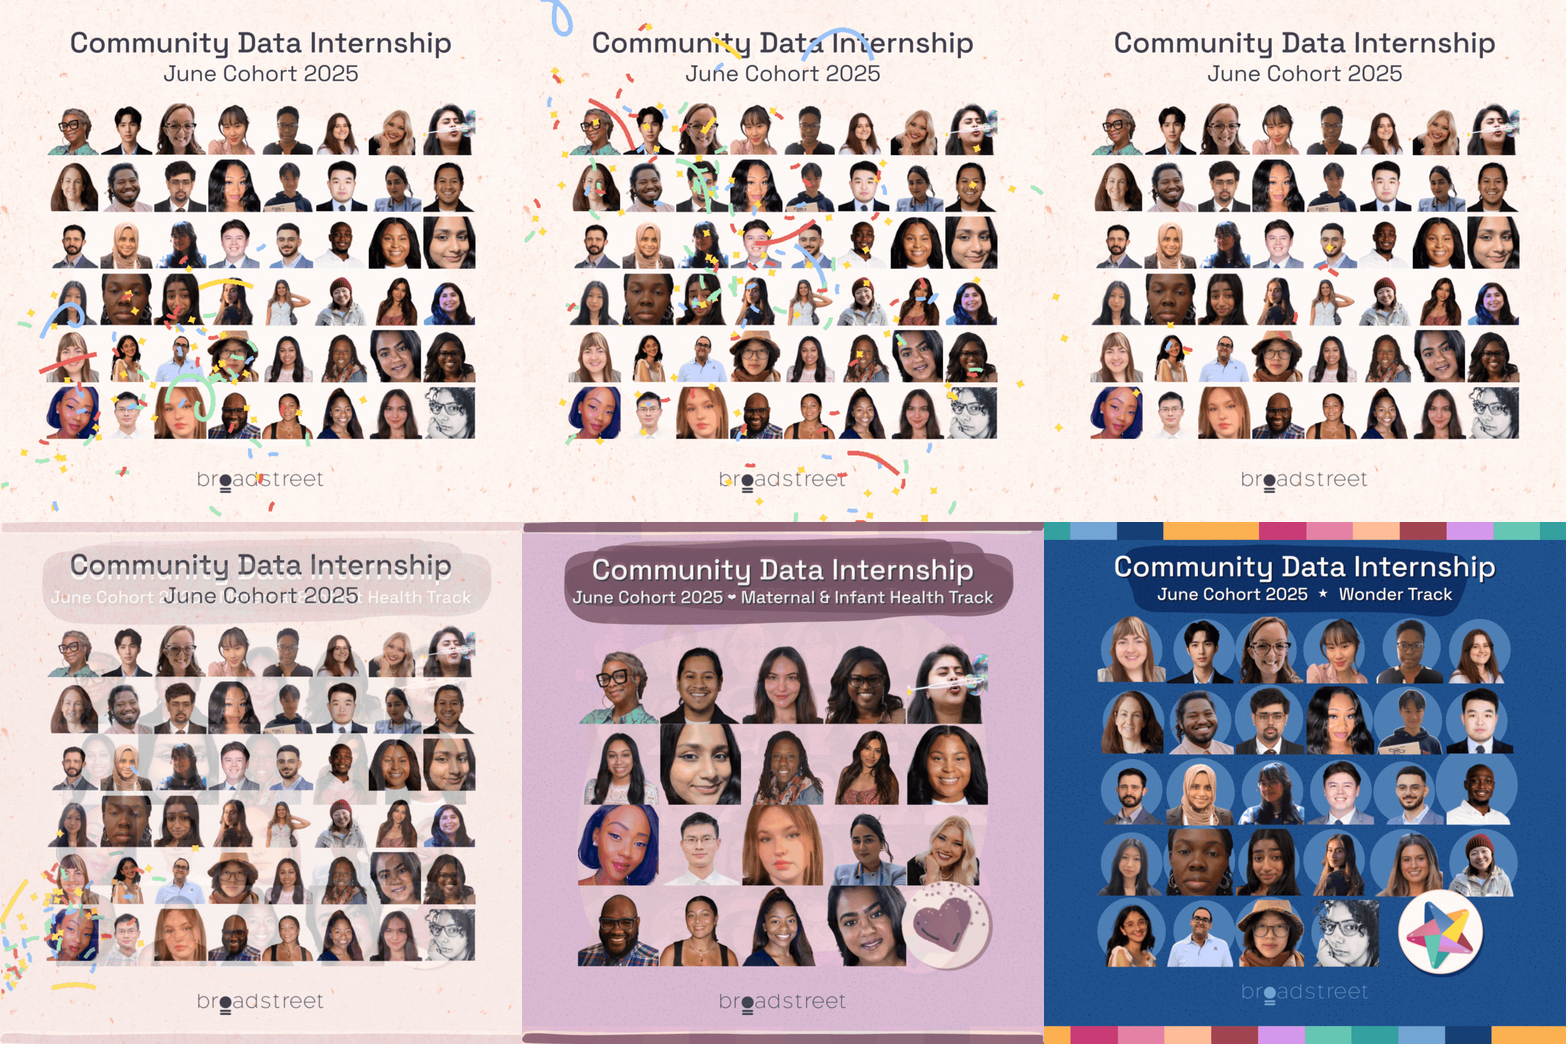

Community Data Internship - June Cohort 2025
Our community is growing! The Community Data Internship 2025 June Cohort is wrapping up their 10-week data projects.

Tracy Flood
Aug 16, 20251 min read


2025 Health Priorities
In early 2025, we collaboratively set our health priorities for 2025.

Tracy Flood
Jun 3, 20251 min read


Welcome 2025 February Cohort
Welcome Community Data Interns of the 2025 February Cohort. We look forward to working with you!

Tracy Flood
Mar 4, 20251 min read


Welcome October Cohort
The Community Data Internship has new team members and we are excited to welcome them!

Tracy Flood
Oct 19, 20241 min read


Congrats August Cohort
A huge congratulations to our 10 Community Data Interns on the BroadStreet Institute's Maternal and Infant Health Track. The internship is a 14-week data project exploring methods for seeking community input. Interns have set goals, envisioned an outreach campaign, and designed and launched assessment surveys. We have loved working with such an engaged and passionate team. A huge thank you to the August Cohort: Canti Laureano, Carmen Huynh, Ezana Kiros, Fitore Roller, Gabby M

Tracy Flood
Oct 18, 20241 min read
Social Posts
Follow us on social media (links in footer) to see upcoming events and updates. We post new updates on social and then summarize and wrap up projects on our Blog.
How We Started

51:27

51:36

44:42

22:08

23:48

24:51

01:33

00:57
bottom of page